class: center, middle, inverse, title-slide # Smail 2020 ### Timing Liu ### Martin Group ### 2021-01-22 --- ## Summary Integration of rare large-effect expression variants improves polygenic risk prediction -- - Integration: a new score that measures **genes with outlier rare variants** in each individual: IOGC -- - Rare variants: MAF < 1% -- - Expression: GTEx outliers -- - Large effect: z-score filtering -- - Improves: <img src = "assets/2021-01-19-21-09-11.png" align="center" style="border: none; box-shadow: none; height: 325px; text-align: center;"> --- ## Expression: GTEx outliers 1. individual *A* is an outlier in RNA-seq data of gene a 2. identify all rare variants in gene a of *A* 3. remove variants that are also present in other individuals B/C/D... <img src = "assets/2021-01-18-10-57-50.png" align="left" style="border: none; box-shadow: none; height: 325px; text-align: center;"> --- ## Study variants' effect to PRS-predicted phenotype  --- ## Why look at outliers  - control set (non-outliers): rare variants in non-outliers with CADD +/- 5 - Outliers & non-outliers are near each other - But outliers have larger effect size --- ## Why look at outliers - larger effect size  - PRS variants have larger allele count but smaller effect size --- ## Why look at outliers - larger odds (ratio?)  - 10,000 permutations - randomly choose one outlier sample and one non-outlier sample (next to PRS site) to compare absolute effect size --- ## Why look at outliers - larger odds (ratio?) Table 1 |abs. effect size|Person A (outlier) | Person B (non-outlier)| |--|--|--| |gene a|1.1|0.5 |gene b|1.3|1 |gene c|0.4|1 Table 2 || A Outlier | B Non-outlier| |--|--|--| |larger|2|1 - odds = 2 -> repeat and get a distribution of odds between outlier vs non-outlier - then repeat and get a distribution of odds among non-outliers Why permutation test? - Not enough variants (8272) so cannot plot raw distribution --- ## Why look at outliers - larger odds (ratio?) Caveat: - The authors said they built a contingency table and calculated **odds ratio** but Qinqin and I could not think of a way the contingency table can be built - There was also no use of tests associated with contingency table: Chi-Square, Fisher's Exact, or Wald Test - The p-value was obtained by Wilcoxon test (to test if the two distributions are the same) - The author explained in later correspondence that the figure showed odds and not odds ratio - will revise the manuscript ??? Across each permutation, the **absolute effect size** for a **randomly-chosen outlier sample** and **matched non-outlier sample** was obtained for each gene and summed in a **contingency matrix** to **quantify the number of genes** where the **outlier variant had an absolute effect size greater than the non-outlier variant** (blue shading). This process was repeated for randomly selected non-outlier variants only (gray). Wilcoxon rank sum test. Subset to genes linked to PRS variants. --- ## Why look at outliers - larger variance <img src = "assets/2021-01-19-22-22-18.png" align="center" style="border: none; box-shadow: none; height: 325px; text-align: center;"> - Dispersion of mean effect sizes per gene for outlier (blue) and non-outlier variants (gray) across genes - stratified by GTEx outlier Z-score. - P-values were obtained using an Ansari Test (`ansari.test`) - non-parametric test for the differences in spread, assuming the centres of the two populations are identical ??? dispersion of variability non-parametric equivalent test for equality of variance test for differences in spread, whhile assuming that the cetnres of two populations are identical - observations are indepdent and identically distributed - two samples must be independent of each other, with equal medians --- ## Outline - **Rare variants** - **Expression** - *Large effect: z-score stratification* - Integration - Improves --- ## Large effect: z-score stratification - larger dispersion <img src = "assets/2021-01-18-14-31-38.png" align="center" style="border: none; box-shadow: none; height: 325px; text-align: center;"> - larger z-scores -> larger dispersion --- ## Large effect: z-score stratification - larger odds ratio  --- ## Outline - **Rare variants** - **Expression** - **Large effect: z-score stratification** - *Integration: a new score that measures **genes with outlier rare variants** in each individual: IOGC* - Improves --- ## IOGC - independent outlier gene count - an individual has two genes - gene 1 has three variants (a1, a2, a3) - effect size: a1 -5, a2 +10, and a3 +3 - 𝑠𝑔𝑛(a1, a2, a3) = (-1, 1, 1) - s1 = [-1, 1] - similarly, s2 = [0, 1] - IOGC = 2 - 1 = 1 (i.e. sum of protective genes - sum of risk genes)  ??? - effect size against what? BMI value? - for each individual - link variants to effect size direction in UKBB - collapse to gene-level - prevent double-counting - convert beta effect estimate per variant to integers using a sign function where 𝛽 is the UKB GWAS beta coefficient for variant 𝑘 --- ## Communication with the author ### Q - why collapse by genes instead of variants? ### A - some variants are very close together and probably in LD (i.e. double counting) - (although this is difficult to estimate with rare variants at current sample sizes) - genes can be linked to GTEx outlier expression --- ## Communication with the author 2.0 ### Q - why not include effect size? ### A - effect size estimates are very noisy at current samples sizes in UK Biobank - (can look at the p-values and standard error of the estimates to appreciate this point) - however, perhaps these estimate are sufficiently powered for effect direction estimate (risk/protective) - as sample sizes increase, it would be a good idea to incorporate these estimates --- ## Outline - **Rare variants** - *Expression: outlier* - *Large effect: Z-score* - *Integration: IOGC* --  **Mean change in BMI per unit change in IOGC score** increases with increase in - `number of GTEx tissues where the variants are identified(g)` - *outlier Z-score (h)* --- ## Outline - **Rare variants** - **Expression: outlier** - **Large effect: Z-score** - **Integration: IOGC** - *Improve* --- ## Improve: stand-alone predictor: across percentiles <img src = "assets/2021-01-19-23-07-58.png" align="left" style="border: none; box-shadow: none; height: 325px; text-align: center;"> - BMI increases with IOGC percentile - Dashed line indicates cohort mean --- ## Improve: stand-alone predictor: two percentile tails  - Rate of obesity, severe obesity (b) and age of obesity and HT can be stratified by IOGC --- ## Improve: stratify PRS <img src = "assets/2021-01-19-21-09-11.png" align="center" style="border: none; box-shadow: none; height: 325px; text-align: center;"> --- ## Improve: more evidence for predicting diabetes 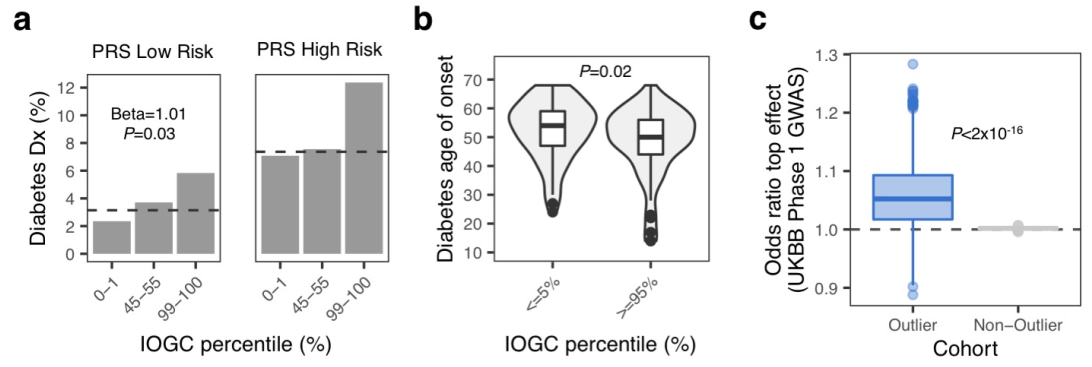 --- ## Improve: other traits (~2400) 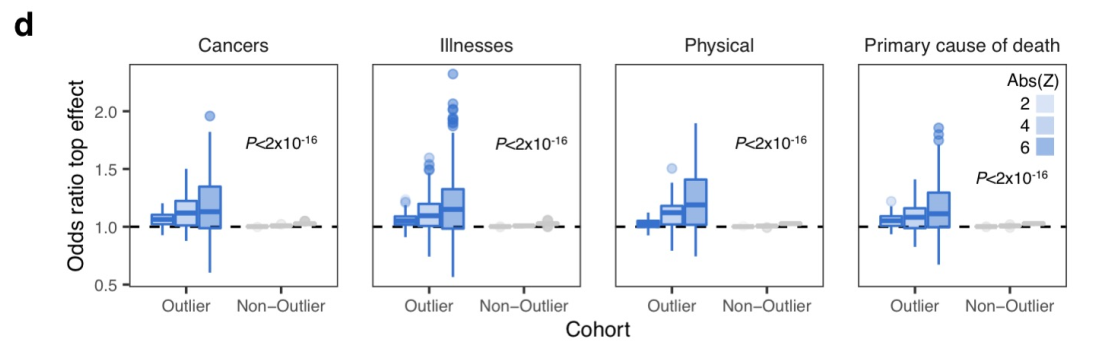 - Shows that outlier can influence odds ratio but did not apply IOGC - IOGC can potentially be helpful --- ## Communication with the author 3.0 ### Q - rare variants without GTEx filtering? - would have done it as my first step if I were to study the effect of rare variants on improving PRS. ### A - The goal of the current paper is to link rare GTEx outlier-associated variants to effects on traits/disease - Several other papers look at all rare variants using (for example) SKAT-O --- ## Conclusion  --- ## Acknowledgements - Hilary for letting me present and recommending this paper - Qinqin for the late-night discussions - Craig Smail (first author) for the very helpful and prompt correspondance --- background-image: url(https://media4.giphy.com/media/lD76yTC5zxZPG/giphy.gif) class: center, top # Thanks!